- Home
- New
- Data
All Datasets
Search by discipline
Search by data type
Search by temporal resolution
Search by time coverage
- Projects
Argo Products OFES Climate Indices Hawaii Regional Forecast Hawaii Regional Climate Model Hawaii Regional Ocean Model Hawaii Regional Page High Wind Occurrence iROAM LADCP Mean Dynamic Ocean Topography Monsoon Monitoring Pacific Argo Regional Center PRIDE Paleoclimate Modeling Precipitation Prediction System SCUD Science on a Sphere
& Magic PlanetSPEArTC Statistical Downscaling - Servers
Web-based servers
OPeNDAP servers
- Tutorials
- IPRC
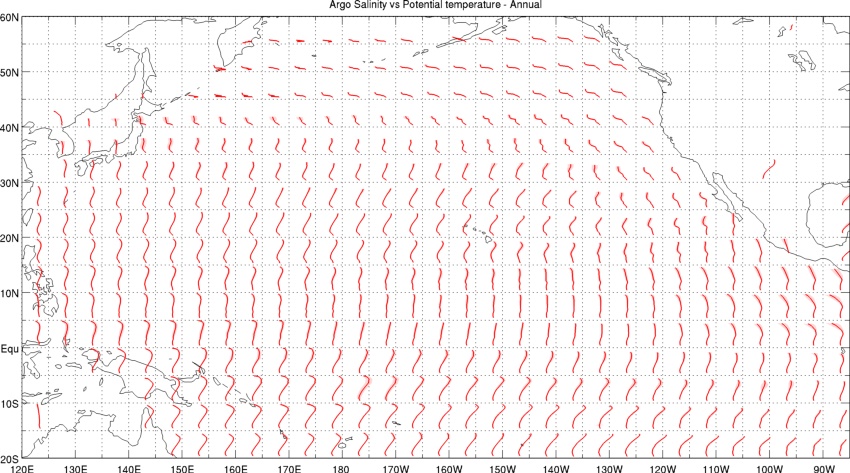
Climatological Argo θ - S and one standard deviation profiles by 5° squares
Instructions:
|
 |
Support by Magic Toolbox
The APDRC may be acknowledged as follows: Data provided by
Asia-Pacific Data Research Center, |
Questions, Comments? |


