DChart
How to use DChart.
The following explains the steps of accessing data using DChart.
Select a dataset on a DChart page:
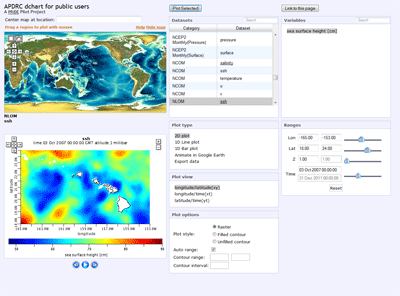
Select the line with "NLOM" under Category and "ssh" under Dataset:
Select SSH:
- Highlight "sea surface height [cm]"
This first example shows how to make a XY plot. Select the geography region and times of interest:
- Default options:
- Plot type: 2D plot
- Plot view: longitude/latitude (xy)
- Plot options: Raster
- Auto range: [checked]
- Type Lon-Lat:
Lon: 195 207
Lat: 18 24
It will automatically change to:
Lon: -165.00 -153.00
Lat: 18.00 24.00
- Type time: 03 Oct 2007 00:00:00
- Click "Plot Selected"
- It will plot the graph

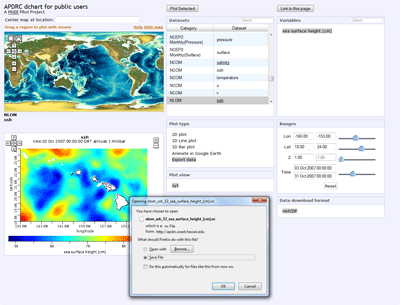
This next example explains how to download a NetCDF file. Select the geography region and times of interest:
- Select options:
- Plot type: Export data
- Plot view: xyt
- Data download format: netCDF
- Type Lon-Lat:
Lon: 195 207
Lat: 18 24
It will automatically change to:
Lon: -165.00 -153.00
Lat: 18.00 24.00
- Type time: 01 Oct 2007 00:00:00
31 Oct 2007 00:00:00 - Click "Plot Selected"
- It will download the NetCDF file (*.nc)

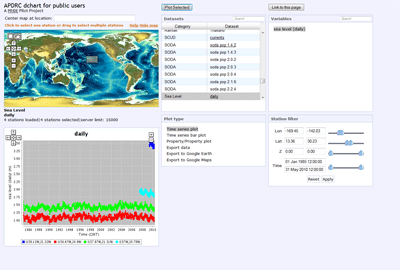
The following example shows how to make a time series plot of sea level from 4 stations in Hawaii (Oahu and Maui). Select the dataset UH Sea Level daily:
- Default options:
- Plot type: Time series plot
- Type Lon-Lat:
Lon: 201 205
Lat: 20 22
It will automatically change to:
Lon: -159.00 -155.00
Lat: 20.00 22.00
Click "Apply"
- This region covers 4 stations for Hawaii (Oahu and Maui)
Use the Set button [rectangle button on the map left-upper corner] to drag selected all 4 stations for Hawaii - Default time: 01 Jan 1985 00:00:00
31 May 2010 00:00:00 - Click "Plot Selected"
- It will plot the graph with 4 different colors


