
- Home
- New
- Data
All Datasets
Search by discipline
Search by data type
Search by temporal resolution
Search by time coverage
- Projects
Argo Products
 OFES
OFES Climate Indices
 Hawaii Regional Forecast
 Hawaii Regional Climate Model
 Hawaii Regional Ocean Model
 Hawaii Regional Page
 High Wind Occurrence
 iROAM
iROAM LADCP
LADCP Mean Dynamic Ocean Topography
 Monsoon Monitoring
 Pacific Argo Regional Center
 PRIDE
PRIDE Paleoclimate Modeling
 Precipitation Prediction System
 SCUD
SCUD Science on a Sphere
& Magic PlanetSPEArTC Statistical Downscaling
- Servers
Web-based servers
OPeNDAP servers
- Tutorials
- IPRC

MATLAB with ncread (built-in)
How to use the OPeNDAP server in MATLAB R2012 or newer with ncread (built-in).
The following explains the steps of loading data served by OPeNDAP using MATLAB.
- Pick one of the three OPeNDAP servers to find the OPeNDAP URL.
- OPeNDAP URL general format describe as below.
- OPeNDAP URL:
http://apdrc.soest.hawaii.edu/dods/[directory(s)]/[dataset] - Authenticated OPeNDAP URL with username and password:
http://username:password@apdrc.soest.hawaii.edu/dods/[authenticated_directory(s)]/[dataset]
- OPeNDAP URL:
- Example in this tutorial using
- NLOM SSH 1/16deg Nowcast OPeNDAP URL:
http://apdrc.soest.hawaii.edu/dods/public_data/NLOM/nlom_ssh
- NLOM SSH 1/16deg Nowcast OPeNDAP URL:
Download and install MATLAB R2012 or newer (if needed):
- Download MATLAB program
Warning: MATLAB R2012 has a bug getting 4-dim data through OPeNDAP. This bug has been fixed in MATLAB R2013 or later.
Start MATLAB:
- matlab
Load data using ncread and proceed as you normally would:
Note: % operator as comments. Example is using MATLAB R2012.
| >> >> >> >> >> >> >> >> >> >> >> >> >> >> >> >> >> >> >> >> >> |
% Information on how to use ncread help ncread % Load the coastline load coast xlon = long; ylat = lat; % Find the indexes for 165W-153W, 18N-24N, and Oct 3, 2004. lon = ncread('http://apdrc.soest.hawaii.edu/dods/public_data/NLOM/nlom_ssh', 'lon'); lat = ncread('http://apdrc.soest.hawaii.edu/dods/public_data/NLOM/nlom_ssh', 'lat'); time = ncread('http://apdrc.soest.hawaii.edu/dods/public_data/NLOM/nlom_ssh', 'time'); I = find(lon >= 195 & lon <= 207); J = find(lat >= 18 & lat <= 24); % Note: datenum and datevec use the time since Jan 0, 0000. % We need to add 365 days to fix the dataset % because this dataset uses since Jan 1, 0001. % datevec(time(1)+365) = [2002 6 1 0 0 0] {start time: Jun 1, 2002} % datevec(mytime+365) = [2004 10 3 0 0 0] {my time: Oct 3, 2004} mytime = datenum([2004 10 3 0 0 0])-365; K = find(time == mytime); % Load the NLOM sea surface height from the above information ssh=ncread('http://apdrc.soest.hawaii.edu/dods/public_data/NLOM/nlom_ssh', 'ssh', [I(1) J(1) K], [I(end)-I(1)+1 J(end)-J(1)+1 1]); worldmap([lat(J(1)) lat(J(end))],[lon(I(1)) lon(I(end))]) setm(gca,'MapProjection','mercator') gridm off % Plot sea surface height pcolorm(lat(J),lon(I),ssh') colorbar % Plot land outlines hold on plotm(ylat,xlon,'k') title('NLOM 1/16 degree Sea Surface Height [cm] October 3, 2004') tightmap |
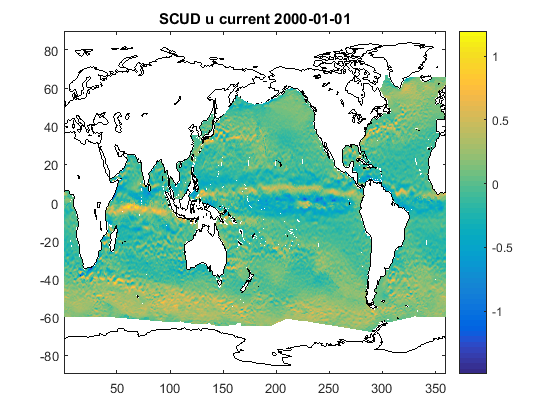
Using pcolor to plot:
| >> >> >> >> >> >> >> >> >> >> >> >> >> >> >> >> |
load coast xlon = long; ylat = lat; lon = ncread('http://apdrc.soest.hawaii.edu/dods/public_data/SCUD/current', 'lon'); lat = ncread('http://apdrc.soest.hawaii.edu/dods/public_data/SCUD/current', 'lat'); time = ncread('http://apdrc.soest.hawaii.edu/dods/public_data/SCUD/current', 'time'); mytime = datenum([2000 1 1 0 0 0])-365; K = find(time == mytime); uc=ncread('http://apdrc.soest.hawaii.edu/dods/public_data/SCUD/current', 'uc', [1 1 K], [1440 720 1]); pcolor(lon,lat,uc') shading interp colorbar hold on plot(xlon,ylat,'k') plot(xlon+360,ylat,'k') title('SCUD u current 2000-01-01') |
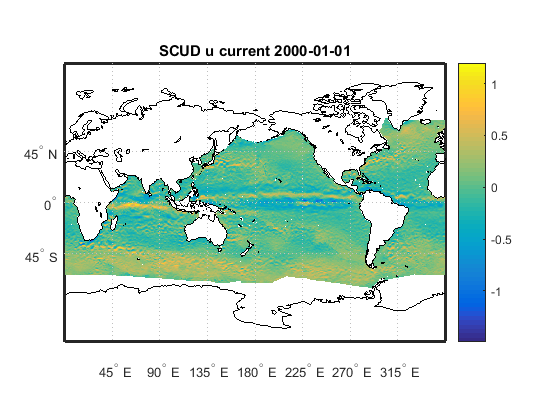
Using pcolorm to plot:
| >> >> >> >> >> >> >> >> >> >> >> >> >> >> >> >> |
load coast xlon = long; ylat = lat; lon = ncread('http://apdrc.soest.hawaii.edu/dods/public_data/SCUD/current', 'lon'); lat = ncread('http://apdrc.soest.hawaii.edu/dods/public_data/SCUD/current', 'lat'); time = ncread('http://apdrc.soest.hawaii.edu/dods/public_data/SCUD/current', 'time'); mytime = datenum([2000 1 1 0 0 0])-365; K = find(time == mytime); uc=ncread('http://apdrc.soest.hawaii.edu/dods/public_data/SCUD/current', 'uc', [1 1 K], [1440 720 1]); ax = worldmap([lat(1) lat(720)],[lon(1) lon(1440)]); setm(ax,'mlabelparallel',-90) pcolorm(lat,lon,uc') colorbar hold on plotm(ylat,xlon,'k') title('SCUD u current 2000-01-01') |
Using load .mat with ERDDAP to plot:
| >> >> >> >> >> >> >> >> >> >> >> |
load(urlwrite('http://apdrc.soest.hawaii.edu/erddap/tabledap/argo_all.mat?longitude%2Clatitude%2Ctime%2Cpres%2Ctemp&time%3E=1998-09-01&time%3C=1998-09-02', 'test.mat')); unique_time = unique(argo_all.time); datestr(unique_time(1)/86400 + 719529) datestr(unique_time(2)/86400 + 719529) time1_i = find([argo_all.time] == unique_time(1)); time2_i = find([argo_all.time] == unique_time(2)); plot(argo_all.temp(time1_i),argo_all.pres(time1_i)) hold on plot(argo_all.temp(time2_i),argo_all.pres(time2_i)) set(gca,'YDir','Reverse') title('ARGO floats pressure vs. temperature on 1998-09-01') |

Using load .mat with ERDDAP to plot Argo floats:
| >> >> >> >> >> >> >> >> >> >> >> |
load coast xlon = long; ylat = lat; load(urlwrite('http://apdrc.soest.hawaii.edu/erddap/tabledap/argo_all.mat?longitude%2Clatitude%2Ctime&time%3E=2017-01-01&time%3C=2017-01-02&distinct()', 'test.mat')); ax = worldmap([-89.9 89.9],[-180 180]); setm(ax,'mlabelparallel',-90) setm(ax, 'FFaceColor', [.6 1 1]) geoshow(ax, ylat, xlon,'DisplayType', 'polygon', 'FaceColor', [.8 .6 .4]) scatterm(argo_all.latitude,argo_all.longitude,15,'k','filled') hold on plotm(ylat,xlon,'k') title('ARGO floats active between 2017-01-01 and 2017-01-02') |

Using load .mat with ERDDAP to plot FNMOC Indian Oceans:
| >> >> >> >> >> >> >> >> >> >> >> >> >> >> >> |
load coast xlon = long; ylat = lat; host = 'http://apdrc.soest.hawaii.edu/erddap/tabledap/fnmoc_temperature_indian.mat'; load(urlwrite(strcat(host,'?longitude%2Ctime%2Clatitude%2Ctemperature&time%3E=2014-01-01&time%3C=2014-01-31&distinct()'), 'test.mat')); ax = worldmap([-60 30],[30 120]); setm(ax,'mlabelparallel',-90) setm(ax,'MapProjection','mercator') setm(ax, 'FFaceColor', [.6 1 1]) geoshow(ax, ylat, xlon,'DisplayType', 'polygon', 'FaceColor', [.8 .6 .4]) scatterm(fnmoc_temperature_indian.latitude,fnmoc_temperature_indian.longitude,... 15,fnmoc_temperature_indian.temperature,'filled') colormap(jet); colorbar hold on plotm(ylat,xlon,'k') title('FNMOC Indian Ocean temperature active between 2014-01-01 and 2014-01-30') |
The APDRC may be acknowledged as follows: Data provided by
Asia-Pacific Data Research Center, |
Questions, Comments? |